Lake Los Carneros

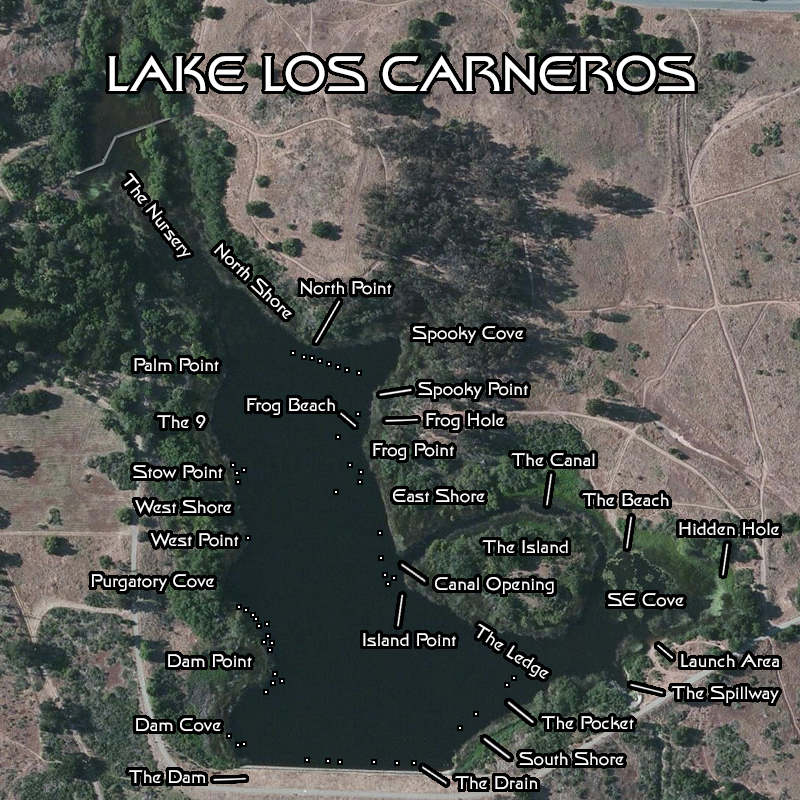
Water Levels, Depths and Rainfall

[Home/History] [Lake Map] [The Dam] [Wildlife] [Eutrophication] [Photo Gallery]

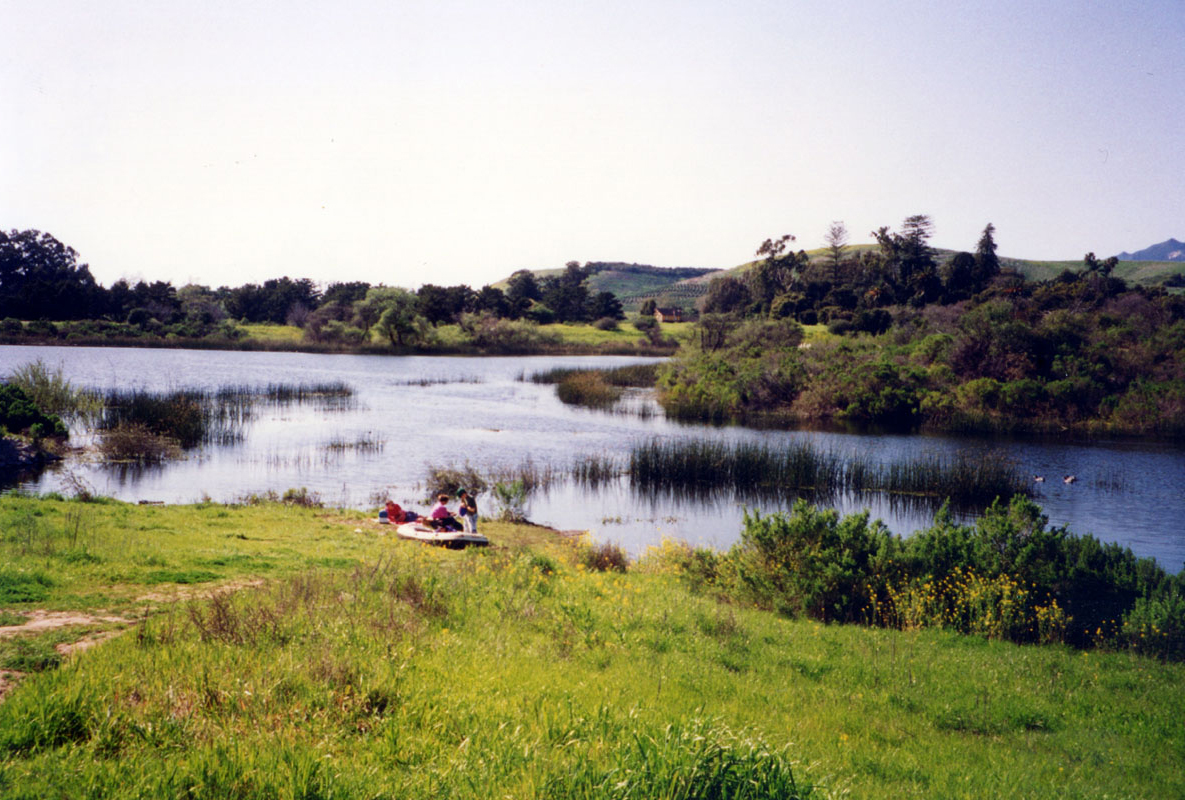
For Lake Los Carneros to remain relatively healthy (little or no eutrophication) it needs about 16-18 inches of rain for at least two years in a row (Goleta Fire Station rainfall monitor). According to the monitor from rain year 1941-1942 through 1955-1956 this was not the case. But in 1955-1956 the trend started to change. Except for a few years in the late 50s/early 60s and early 70s the rainfall totals were close to average for at least two years in a row. In fact, for a 10 year period from 1972-1973 through 1982-1983 there was never more than a year in a row of below average rain. This coincides with the stories I hear of the lake being "healthy" and full most of the time during the 70s. In the 80's we entered another period where we did not get two years in a row of enough rain and the lake suffered. This pattern ended in 1991 and while it took a couple of years for the lake to spill from 1993 through 2011 there were only five years of less than 17 inches of rain. The lake never dropped below ~9 ft below spill level and was, except for a few years scattered throughout relatively healthy. Similar to the 60s and 70s the lake went through a period of being "healthy and full" most of the time. Unfortunately this 18 year healthy streak ended in 2012 with the start of another period of not getting two years in a row of enough rain.

When I first visited Lake Los Carneros in the Fall 1983 the water level of the lake was ~12 ft. below spill level. A nearly 50 inch rain rain year in 1982-1983 lead me to find out that these low levels were the result of the lake being artificially lowered.

~3 ft. below spill level

~9 ft. below spill level

~11 ft. below spill level

~14 ft. below spill level

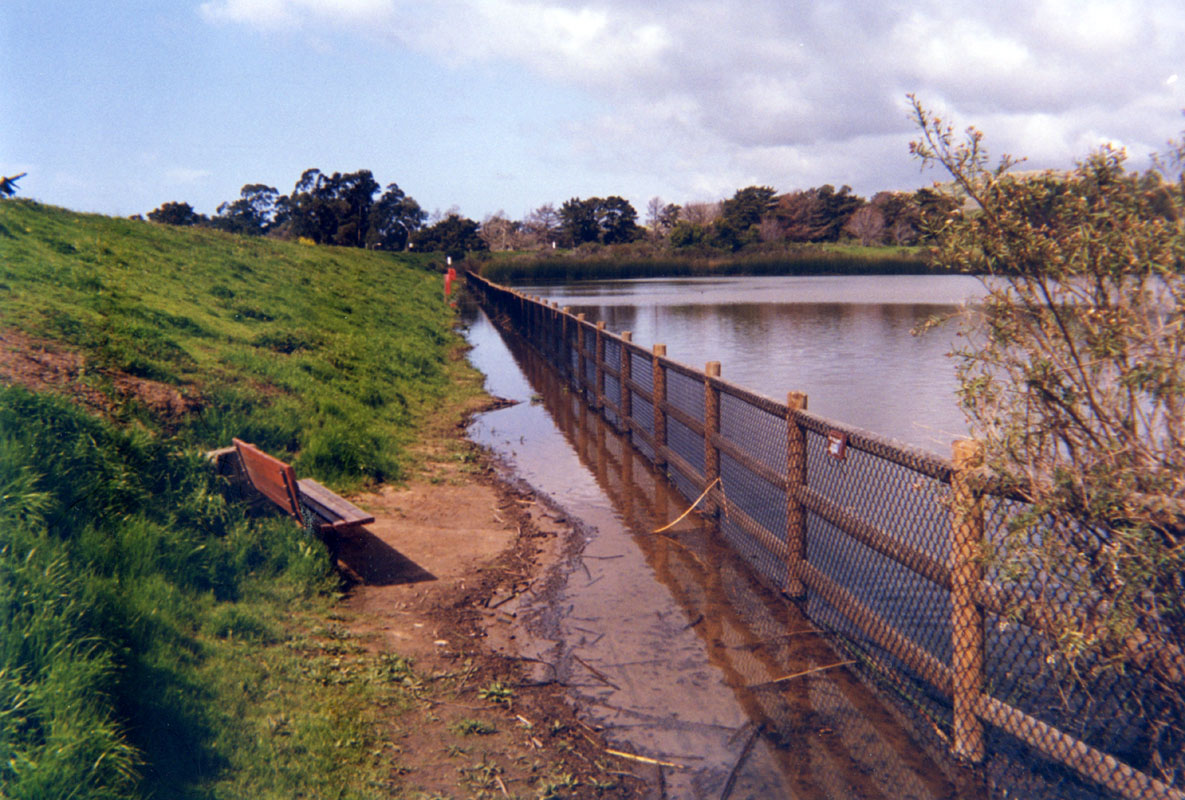
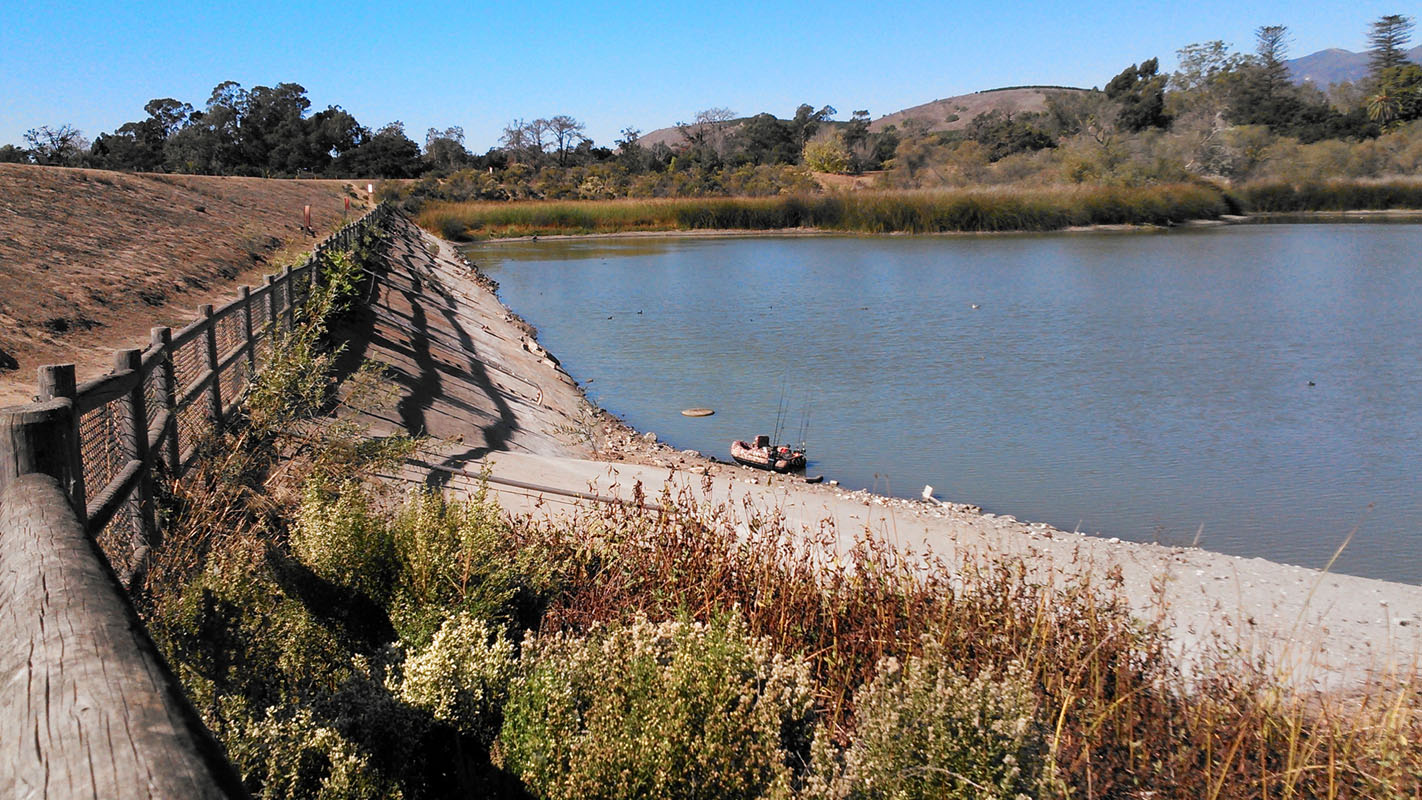
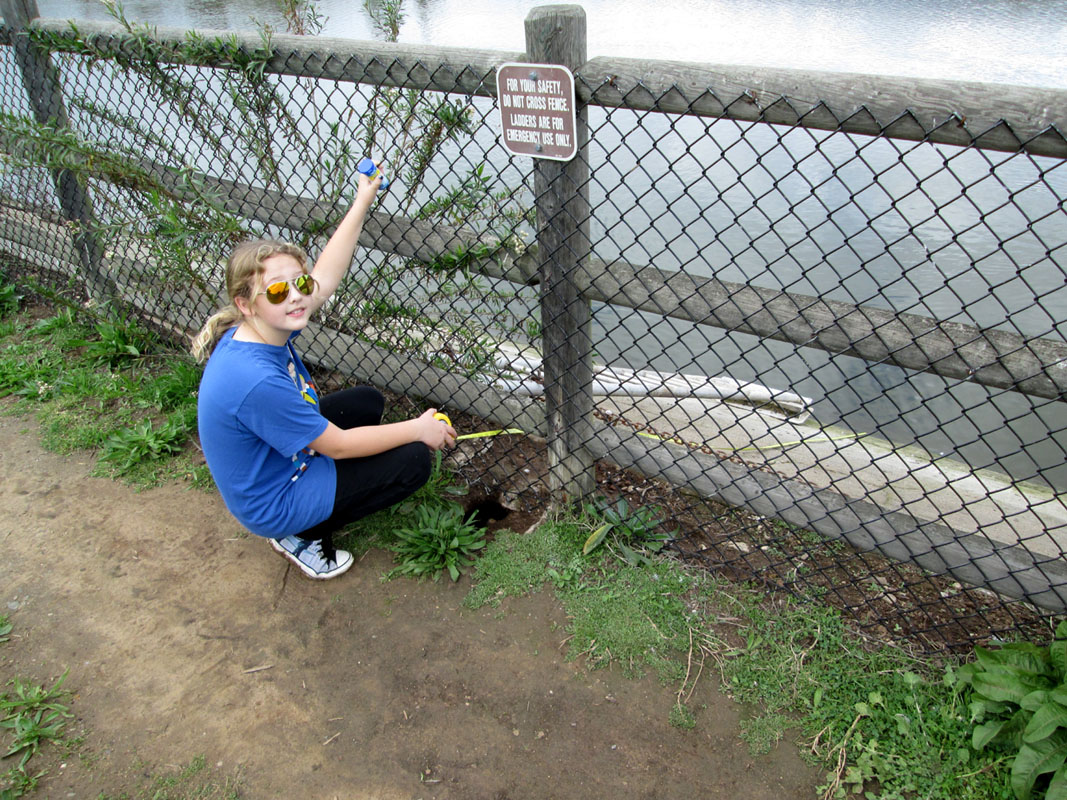
This period of low rain caused the water level of the lake to drop to over 15 ft. below spill level in early 1991. The "March Miracle" rain of 1991 produced over 12" of rain in one month brought the lake back up a couple of feet from spilling. Although close to spilling in 1992 the lake did not actually spill (for the first time since 1983) until 1993. The "March Miracle" rain of 1991 was the beginning of another period of 17 inches of rain for two (or more) years in a row which lasted until 2011. During this period the lake spilled numerous times and flourished from the repeated "water changes" nature was providing.

Low Water Level Markers:

~8 ft. below spill level:
The bottom of the ladder furthest to the East exposed

~10 ft. below spill level:
The ledge just barely exposed

~12 ft. below spill level:
The drain exposed and pipe out beyond the drain visible

~14 ft. below spill level:
The pipe out beyond the drain exposed

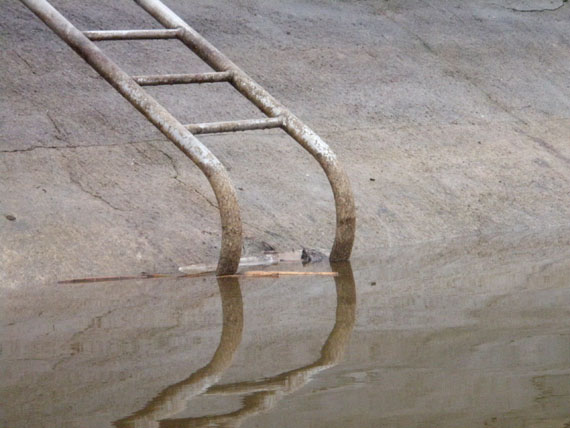
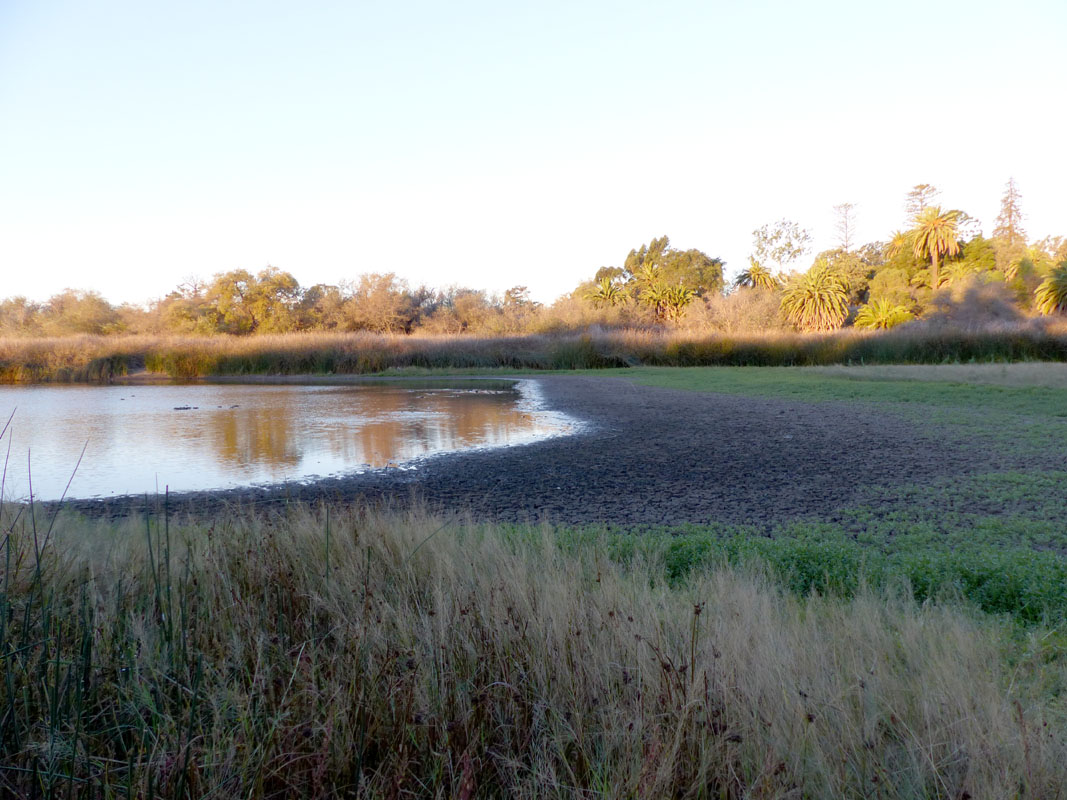
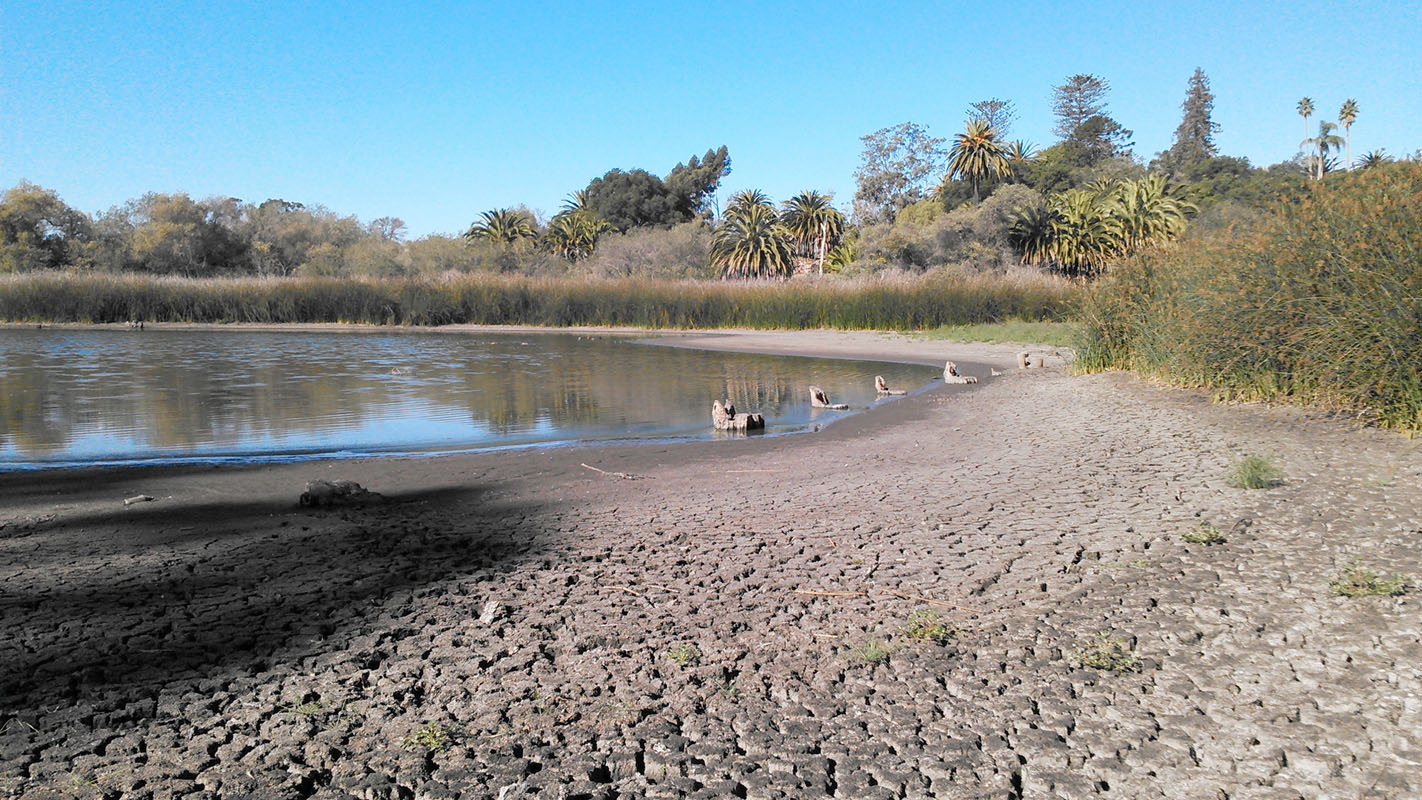
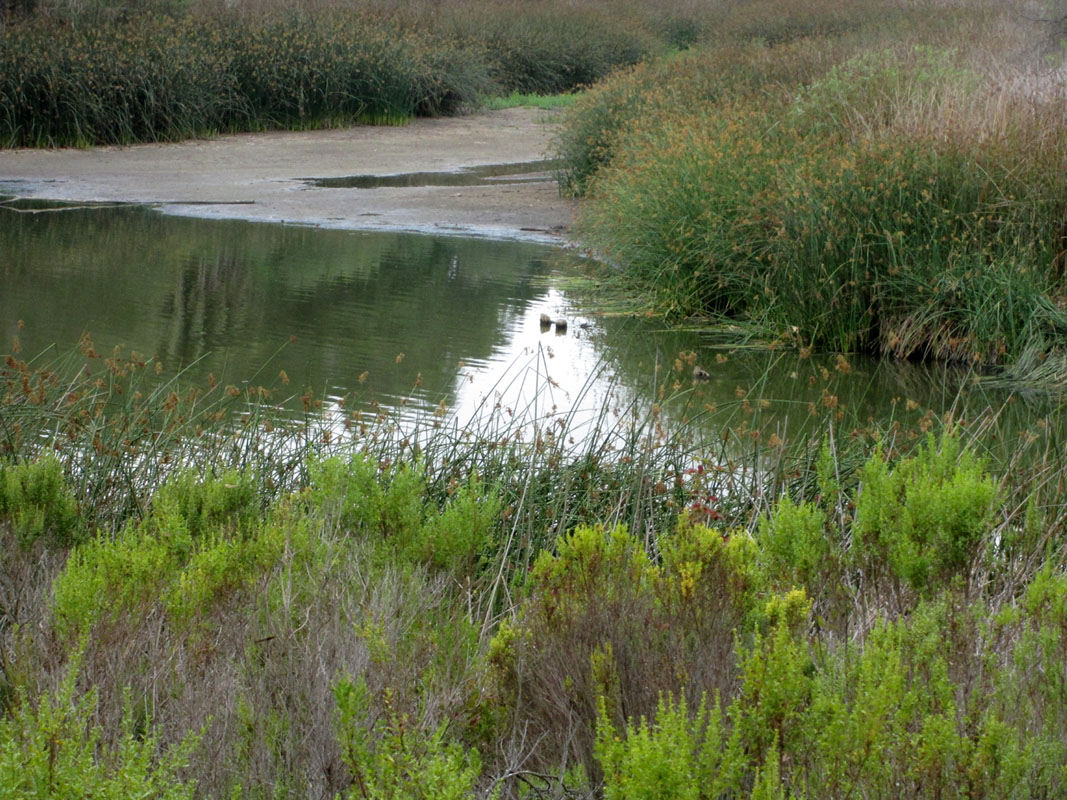
Unfortunately 2012 was the start of another period low rainfall. Causing the water level of the lake to pass 10 ft. below spill level for the first time in over 20 years. In October of 2014 the water level dropped to over 11 ft. below spill level and exposed the drain of the dam for the first time since the "March Miracle" rains in 1991.

April 1993: Lake spills for the first time in over a decade

November 2014: Spillway completely dry

January 2005: Lake spilled causing the water to nearly reach the walking trail through Spooky Cove

October 2015: Nearly a straight line from Frog Beach to Stow Point as the water level reaches ~13.5 ft. below spill level

A little over 7 inches of rain in November and December of 2014 provided an additional 3 ft. of fresh water pushing it back up to just a little over 8 ft. below spill level. This combined with another 4.5 inches of rain in 2015 was not enough to keep the water from dropping to a historic ~13 ft. below spill level by the Fall of 2015.

Spring 2011: Bird's eye view of a completely full Lake Los Carneros

September 2014: Tree Stumps visible as water level reaches ~11.5 ft. below spill level

March 1993: Lake spills for the first time since 1983

April 2001: Lake Full

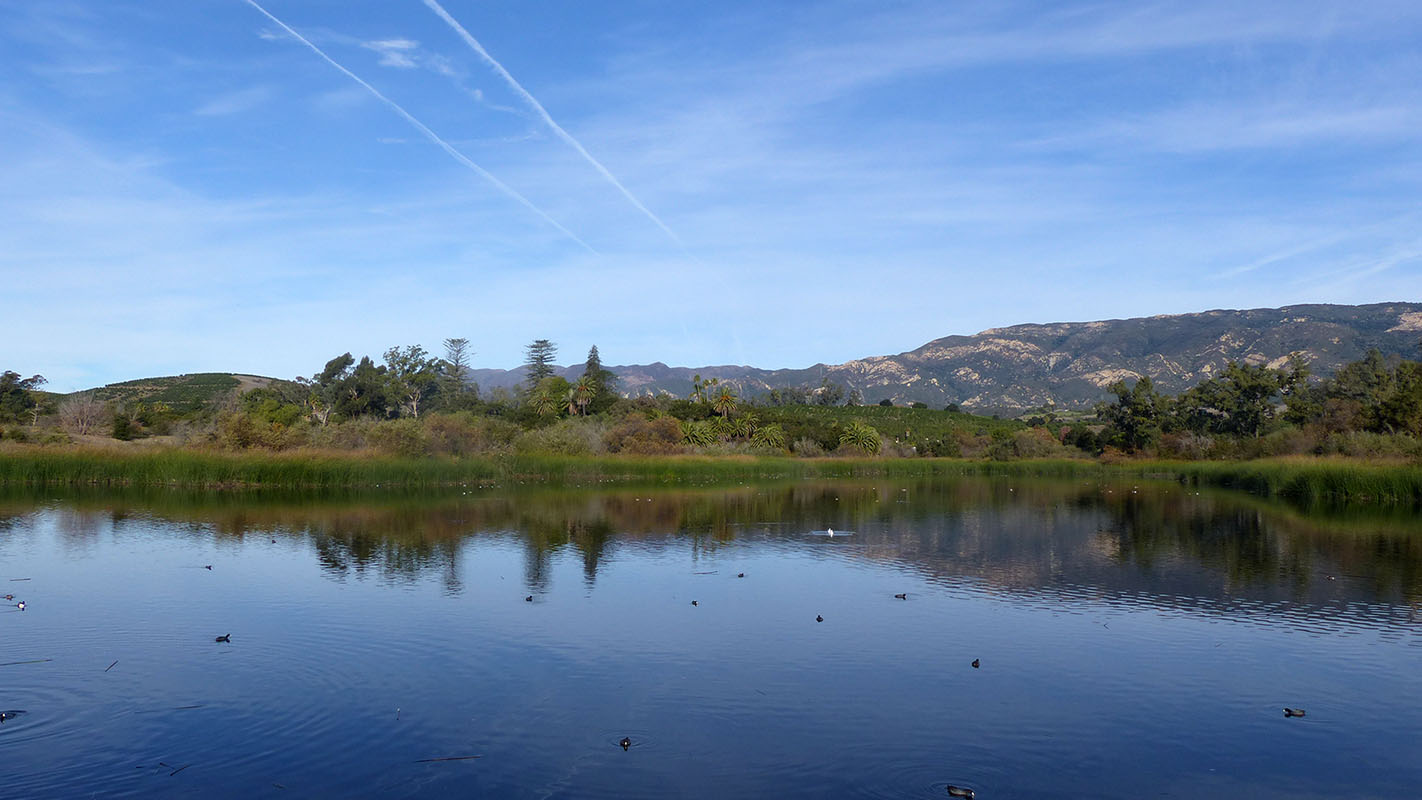
The water level dropped to over 14 ft. below spill level by December of 2016. Above average rain in February and March of 2017 added nearly 13 feet of water into the lake. Bringing the water level to within a little over a foot from spilling but unfortunately 2018 was another year of below average rainfall. This pattern continued through 2022.

On March 22, 2023 Lake Los Carneros spilled for the first time since 2011. Another 20+ inches of rain in 2024 caused it to spill again in 2024. Prior to that between 1993 and 2011 there were only four years the lake did not spill (or come within a foot or two of spilling).

October 2014: Water level ~12 ft. below spill level

December 2019: Water level ~6 ft. below spill level

July 2014: Tree Stumps just barely visible as water level reaches ~10 ft. below spill level

February 2015: Measuring the water level between storms


Lake Depths

1999 Depth: ~20 ft. (measured using an electronic depth finder)
2011 Depth: ~19 ft. (measured using a marked rope with a weight on the end)


Rainfall & Water Levels

Update - March 24, 2024: Another 20 inch rain year so far. Two years in a row of above average rain. Something that hasn't happened since 2011 and hopefully the beginning of another "wet" period like 1993 through 2011 and in the 70's where the lake never dropped more than 9 ft. below spill level.

Update - March 22, 2023: At just over 28 inches of rain for the 2022-2023 rain year Lake Los Carneros spilled for the first time since 2011.

Year Month Feet below spill level
(approximately)
2024 March 0.0
2023 October 6.0
Water Year Rainfall Total: September 2023 - August 2024 21.61"
2023 July 5.0
2023 April 3.0*
2023 January 0.0
2022 October 5.0
Water Year Rainfall Total: September 2022 - August 2023 32.18"
2022 July 10.0
2022 March 9.0
2022 January 8.0
2021 October 9.0
Water Year Rainfall Total: September 2021 - August 2022 11.91"
2021 July 9.0
2021 April 6.0
2021 January 8.0
2020 October 7.0
Water Year Rainfall Total: September 2020 - August 2021 9.07"
2020 July 6.5
2020 April 10 5.4
2020 February 6.4
2020 January 6.2
2019 December 6.0
2019 November 7.8
2019 October 7.3
Water Year Rainfall Total: September 2019 - August 2020 14.09"
2019 July 5.0
2019 April 2.5
2019 March 2.3
2019 January 7.6
2018 November 11.6
2018 October 10.9
Water Year Rainfall Total: September 2018 - August 2019 24.78"
2018 July 9.1
2018 April 6.9
2018 March 6.3
2018 January 8.5
2017 October 7.2
Water Year Rainfall Total: September 2017 - August 2018 9.15"
2017 July 5.4
2017 April 3.3
2017 February 1.8
2017 January 11.4
2016 December 15.0
2016 October 14.6
Water Year Rainfall Total: September 2016 - August 2017 25.26"
2016 July 12.9
2016 April 10.6
2016 March 10.2
2016 January 14.2
2015 October 13.3
Water Year Rainfall Total: September 2015 - August 2016 11.13"
2015 July 11.5
2015 April 9.7
2015 March 8.9
2015 January 9.0
2014 October 12.1
Water Year Rainfall Total: September 2014 - August 2015 11.58"
2014 July 10.0
2014 April 8.0
2014 March 7.5
2014 February 9.8
2014 January 9.7
2013 October 9.0
Water Year Rainfall Total: September 2013 - August 2014 6.88"
2013 July 7.3
2013 April 5.4
2013 February 4.5
2013 January 5.5
2012 November 6.7
2012 October 6.5
Water Year Rainfall Total: September 2012 - August 2013 11.03"
2012 July 4.5
2012 April 3.0
2012 January 3.0
2011 October 4.0
Water Year Rainfall Total: September 2011 - August 2012 13.60"
2011 July 2.0
2011 April 0.3
2011 January 0.0
2010 October 5.0
Water Year Rainfall Total: September 2010 - August 2011 31.27"
2010 July 3.0
2010 May 1.6
2010 April 2.3
2010 January 5.5
2009 October 8.0
Water Year Rainfall Total: September 2009 - August 2010 21.64"
2009 July 6.5
2009 April 4.5
2009 March 3.5
2009 January 4.8
2008 December 6.0
2008 October 5.0
Water Year Rainfall Total: September 2008 - August 2009 11.57"
2008 July 3.0
2008 April 1.5
2008 January 6.0
2007 October 8.0
Water Year Rainfall Total: September 2007 - August 2008 17.37"
2007 July 6.0
2007 April 4.0
2007 January 4.5
2006 October 7.0
Water Year Rainfall Total: September 2006 - August 2007 7.40"
2006 July 5.0
2006 April 3.0
2006 January 5.0
2005 October 4.0
Water Year Rainfall Total: September 2005 - August 2006 23.92"
2005 July 2.0
2005 April 0.0
2005 January 0.0
2004 October 5.5
Water Year Rainfall Total: September 2004 - August 2005 38.22"
2004 July 3.5
2004 April 1.5
2004 January 2.0
2003 October 3.5
Water Year Rainfall Total: September 2003 - August 2004 10.98"
2003 July 1.5
2003 April 0.0
2003 January 2.5
2002 October 7.5
Water Year Rainfall Total: September 2002 - August 2003 23.78"
2002 July 5.5
2002 April 3.5
2002 January 2.0
2001 October 4.0
Water Year Rainfall Total: September 2001 - August 2002 9.05"
2001 July 2.0
2001 April 0.0
2001 January 4.0
2000 October 4.0
Water Year Rainfall Total: September 2000 - August 2001 24.39"
2000 July 2.0
2000 April 0.0
2000 January 7.0
1999 October 7.0
Water Year Rainfall Total: September 1999 - August 2000 22.85"
1999 July 5.0
1999 April 3.0
1999 January 4.0
1998 October 3.0
Water Year Rainfall Total: September 1998 - August 1999 11.85"
1998 July 1.5
1998 April 0.0
1998 February 0.0
1998 January 1.0
1997 October 7.0
Water Year Rainfall Total: September 1997 - August 1998 47.03"
1997 July 5.0
1997 April 3.0
1997 January 1.0
1996 October 4.0
Water Year Rainfall Total: September 1996 - August 1997 18.07"
1996 July 2.0
1996 April 0.0
1996 February 0.0
1996 January 2.0
1995 October 3.0
Water Year Rainfall Total: September 1995 - August 1996 17.35"
1995 July 1.5
1995 April 0.0
1995 January 0.0
1994 October 6.0
Water Year Rainfall Total: September 1994 - August 1995 38.34"
1994 July 4.0
1994 April 2.0
1994 January 4.0
1993 October 4.0
Water Year Rainfall Total: September 1993 - August 1994 13.87"
1993 July 2.0
1993 April 0.0
1993 January 2.0
1992 October 7.0
Water Year Rainfall Total: September 1992 - August 1993 28.50"
1992 July 5.0
1992 April 3.0
1992 January 4.0
1991 October 7.5
Water Year Rainfall Total: September 1991 - August 1992 19.74"
1991 July 6.5
1991 April 4.5
1991 February 15.6
1991 January 15.5
1990 October 15.5
Water Year Rainfall Total: September 1990 - August 1991 18.22"
1990 July 14.8
1990 April 13.5
1990 January 12.9
1989 December 13.0
1989 October 12.9
Water Year Rainfall Total: September 1989 - August 1990 7.04"
1989 July 11.5
1989 April 9.0
1989 January 6.0
1988 October 7.0
Water Year Rainfall Total: September 1988 - August 1989 9.11"
1988 July 4.0
1988 April 3.0
1988 January 2.0
1987 October 6.0
Water Year Rainfall Total: September 1987 - August 1988 14.42"
1987 July 4.0
1987 April 3.0
1987 January 5.0
1986 October 4.0
Water Year Rainfall Total: September 1986 - August 1987 11.94"
1986 August 5.5
1986 July 4.5
1986 April 2.0
1986 January 10.0
Water Year Rainfall Total: September 1985 - August 1986 22.26"
1985 October 14.0
1985 July 12.0
1985 April 10.4
1985 January 9.5
1984 October 14.8
Water Year Rainfall Total: September 1984 - August 1985 14.71"
1984 July 13.8
1984 April 12.9
1984 January 10.3
1983 November 13.0
1983 October 12.5*
Water Year Rainfall Total: September 1983 - August 1984 15.41"
Water Year Rainfall Total: September 1982 - August 1983 47.93"

*Known occurrences of lake being lowered. 2023 was slightly (maybe a foot?). 1982 was all the way to the drain (12 ft. down) just after a historic nearly 50 inch rain year where the lake would have been spilling and then some.

Contact: pete@lakeloscarneros.com